Introduction
The pricing of consumer innovations is often a mystery. How do disruptive companies determine their pricing strategies? Are there specific principles at play? While there are some useful resources available, I have not found a step-by-step guide that provides practical advice for founders and Product Managers in fast-growing companies. Below is my attempt to make that guide, drawn from my experience working on product pricing at ZOE.
Context
First, understand your context and your objectives.
When we began refining the pricing model at ZOE in 2021, the business operated on a one-time payment basis, which included a lifetime subscription. The product comprises a test kit, which is sent once at the beginning of the customer journey, a companion app for the test experience, and an insights app as a companion post-results. When I joined, the test kit offered personalized health insights to our members, and the app performed two primary functions: delivering daily content to members and allowing them to manually log food (a simplified version of MyFitnessPal) to receive personalized food scores based on their insights. Given that the companion app was meant for ongoing use, the one-off payment model didn’t capture all the value we delivered. Our goal was to unbundle the kit and subscription to match the value delivered to customers with the value captured by the business, achieve healthy margins, and increase our Lifetime Value (LTV) through improved subscription retention.
Our challenge was the following: How do you unbundle and price separately what is now seen as one product?
Definition: What is Successful Pricing for us?
Define your stage and goals: try to be both clear on what success looks like and ideally quantify it.
As a young upstart, successful pricing meant customers were willing to pay, and the product would be profitable with healthy unit economics. Consequently, we needed customers to be comfortable with long-term app subscriptions (paid retention), understand the mental models imposed by competition, and use pricing that supports our differentiation appropriately. For an innovative consumer brand competing heavily on brand image, pricing that balances growth and profitability while maintaining a strong brand image, without necessarily competing on price, is a good option. However, for an economies of scale play, different principles apply. Understanding what the business model requires of pricing should be done first.
Principles & constraints
Collect comprehensive data on competitors to understand market pricing ranges and structure.
We aimed for an effective, yet “simple” pricing model focused on Product-Market Fit (PMF) and growth, without optimizing to extract maximum value from all customer segments. The thinking was that in the future, one can always revisit pricing and make it more complex but before PMF a pricing model that yielded a healthy margin and allowed us to scale was the goal. Finally, as an innovative, high-end product and with our minds set on establishing a highly credible, unique brand image in an established market, we did not want to compete on price. We needed pricing to further support our disruptive proposition.
Pricing research stages:
Analyze Your Competition
First, start with competition. It’s great to start with competition as long as: a) you know how you are competing e.g. differentiation vs price and b) make sure to stay on your track vs get swayed by what others do. Collect data and make pricing tables from several companies in the space, including international pricing where applicable. Identify top winners in the category (e.g. Noom for nutrition) and make reasonable assumptions about their margin structure, analyzing their subscription tiers, conversion rates, retention, and overall economics. Take this seriously so that you can trust the numbers.
This is exactly what we did. Here’s a simple, estimation for Noom for 2021.
Table: Noom Guesstimation of financials (LTV, CAC, conversion)
| Aspect | Details |
| CAC (Customer Acquisition Cost) | $75 – $100 ** estimation |
| Free Trial Cost | $0 (revenue of $10 per 7-day trial) |
| Conversion Rate (Free Trial to Paid) | 10-20% ** our estimation |
| Typical Package Price (4 months) | $129 |
| Revenue from 4-month Package | $75 – $100 margin |
| Revenue from 12-month PackageAssumed paid renewal (across tiers) | $199 ($130 margin)30% |
| Assumed LTV | $200+ |
| LTV to CAC Ratio | At least 2:1 |
| Affiliate Payment per Free Trial | $10 |
We now had a good benchmark on what the LTV is for the status quo in our market: ~$200.
Another very valuable and underrated task is to study and talk to others who might not be direct competitors but are selling in the same customer segment and/or using the same business model. At ZOE, we extensively studied similar successful models such as Peloton, Whoop, and 23andMe, focusing on how they priced and upsold customers, as well as how they utilized further upsells and B2B data. In some cases, we sought to speak to people with deep insights into these companies. This approach helped clarify many key questions and informed our directional decisions:
- What is the impact on conversion if you include shipping as a cost? Price sensitivity does matter (e.g., $10 vs. $8).
- Should you break down the cost of the physical product (e.g., Whoop, test kit)? Yes, but not for early adopters.
- Is it okay to be an expensive product? When entering the mass market, you inevitably need to lower the price, offer installments, and provide discounts. We saw 10x conversion improvements here.
- What would be the CAC payback period? What balance sheet is required to scale?
- What referral rates should we expect?
This process of talking to those who have successfully done what you’re trying to do is invaluable for going a layer deeper and gaining confidence in key assumptions about your pricing model. Here’s why:
There are many ways to get a puzzle wrong but only one way to get it right. Learning from those who have cracked it can go a long way.
Output: Max pricing in the category at the moment, existing mental models, levers of conversion, upselling as a component of revenue and LTV: CAC assumptions.
Internal Structure
Next, make progress in understanding the COGS for all product components even if they are bundled today (in our case a test kit and subscription app).
Here’s what it looked like for us:
- Test Kit: Ops had a really tight understanding of the margins and the today vs. future cost of each component at different volumes. We decided to price competitively (in the US) with a strategic markup, anticipating possible cost reductions through in-house testing or exclusive partnerships.
- Subscription: Calculated costs involving human support, software costs, payment processing costs, leading us to determine the break-even point and monthly cost changes over time.
Margin Structure and Modelling
We reviewed various margin structures and adjusted floors as necessary. The numbers used were fabricated, and the figures below are also fictitious.
Table: Example LTV & Contribution Margin Analysis
| 1m Price ($) | 4m ($) | 12m Price ($) | Fixed Cost ($) | Mean ARPU (1/3 per tier) | +30%paid retention | 1m Cont. Margin (%) | 4m cont. Margin (%) | 12-Month cont. Margin (%) | Total: cont. Margin ($) | Profit Margin (LTV – CAC – COST) ($) |
| 9 | 29 | 99 | 28 | 45.6 | 59.3 | -211% | 3% | 72% | 59.3 | -40.6 |
| 29 | 79 | 149 | 28 | 85.6 | 111.3 | 3% | 65% | 81% | 111.3 | 11.3 |
| 59 | 149 | 229 | 28 | 145.6 | 189.3 | 53% | 81% | 88% | 189.3 | 89.3 |
Knowing where we stood in terms of upper and lower bounds, we were ready to progress to the interesting part: research with customers which we hoped would unveil their problems, explain internal reasoning, their deeper “whys” and guide us to price accordingly.
Output: Lowest floor for pricing (Our break even) and highest possible (most expensive competitor).
Your own product
List your value drivers
Assuming you have an understanding of your value proposition and ideally some feedback, you can make reasonable guesses about what parts of the product customers value. Isolate them and state them. This is what we did.
We started by stating hypotheses around future value drivers. Examples:
Retesting
- Retesting is a motivating commitment because XYZ.
- ….
Coaching
- Short, frequent chat coaching is higher value than less frequent, longer video coaching.
- ….
Food Scoring
…
Output: List of perceived value drivers
Understanding overall product perception and comparables.
Understand your product comps, substitutes, and edit the language of your product according to your goals. The technical details of the solution, or “what you are selling,” are less important than how customers and the market perceive it. The market’s understanding and perception of your solution is crucial. Mispositioning can be fatal, whereas correct positioning can be the winning element.
We began by gathering qualitative insights from understanding comparable products, which proved very useful. In our case, some of the questions we wanted to understand were: Is ZOE closer to a gym subscription, a health plan, or an app? What kinds of members perceived us in each category? How do our users perceive the test? What words do they use to describe it? What descriptors do members who highly value the service use?
We determined our positioning based on perceived value, identifying high-value features and adjusting the pricing model accordingly. We also changed the language and positioning of the offering (e.g., health program vs. diet plan, ZOE Test kit vs. blood test or CGM).
Product Perception Assessment
Start by understanding how much your customers are willing to pay and their perceived value of each component. Willingness to pay surveys are a good first step.
We began by assessing the willingness to pay and perceived value of the Test and the App as two separate entities for the first time. We used a “willingness to pay” framework for interviews first, and surveys to gather responses on larger samples on price perceptions, such as what would be considered cheap, affordable, expensive but still worth buying, and unaffordable. Much later we used more complex methods like Van Westendorp Price Sensitivity Meter.
It’s important to note that the actual survey included numerous other qualifying questions to ensure participants had an adequate understanding of the product and that their responses were a good fit for the analysis.
At what price would the ZOE test kit be:
- Cheap:
- Affordable
- Expensive but would buy
- Unaffordable
At what price point would the ZOE program be:
- Cheap:
- Affordable
- Expensive but would buy
- Unaffordable
If you are innovating through product differentiation the only price point range is one where your target market says “It’s on the higher end but I would buy!”. Below that, you’re leaving money on the table. Above that, you’re “expensive”.
Within the first 5 people you speak to you will know how they view the service. These discussions are gold to understand the “why” behind every answer. Then you can refine, edit, and scale the survey and send it to more people.
The first simple, and likely good enough analysis, would be to take responses and perform simple statistics on each of the categories. What is the mean value for each category e.g. “cheap”? What is the standard deviation value? Then you can define the range as 1,2 STDs.
Here’s an example:
| Category | Mean ($) | Standard Deviation ($) | Lower Range ($) | Upper Range ($) |
| Too Cheap | 11.79 | 1.82 | 9.98 | 13.61 |
| Affordable | 22.07 | 2.86 | 19.21 | 24.93 |
| Expensive but would buy | 38.26 | 4.34 | 33.92 | 42.60 |
| Too Expensive | 58.53 | 4.42 | 54.11 | 62.95 |
Each price point is information. “Too expensive” does not mean “do not touch”! Each value provides leverage to direct people in the price you want.
For instance, if there’s consensus that $58.53 is expensive then price your least business-favorable tier as such and sway the majority toward the price point you identify as optimal.
The “expensive but would buy”, in this case $38.83, can become the 4-month tier, and the middle option in your typical three option table.
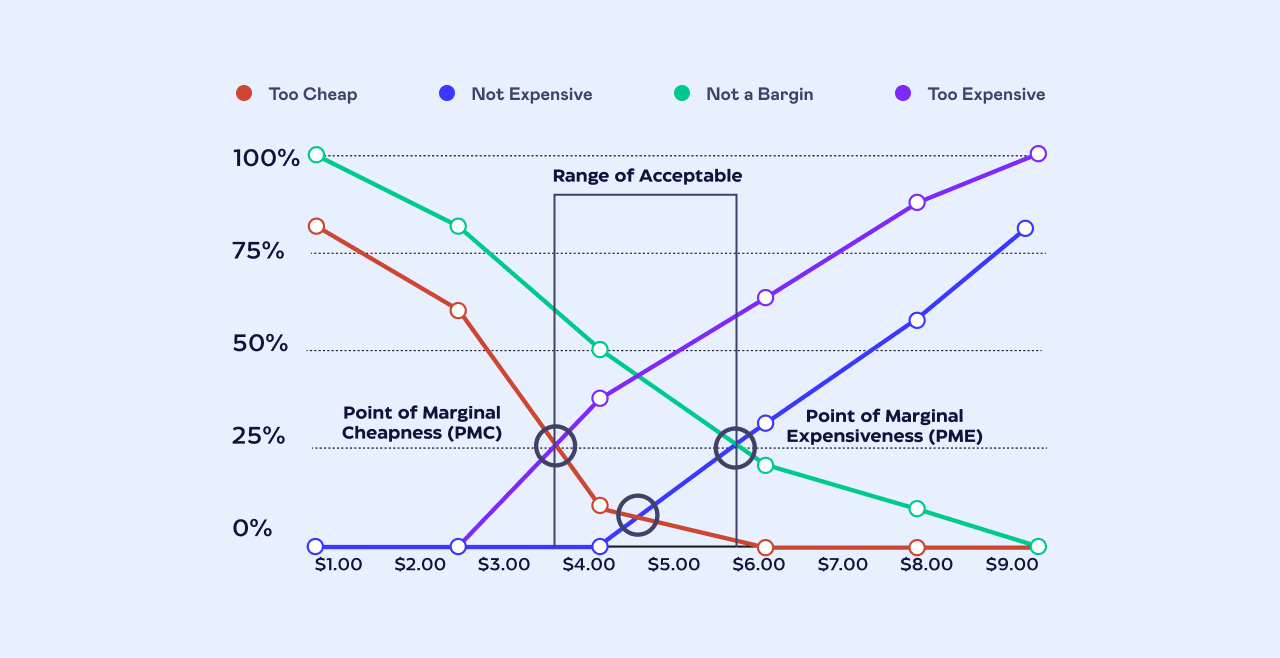
As a next step the Van Westendorp (later stage, large samples) is visually appealing and useful to model revenue scenarios.
Feature Value assessments
We then asked participants to rank specific features in terms of value as low, medium, or high. For example:
- How would you rate the ability to book sessions with coaches? [ LOW / MED / HIGH ]
- How would you rate the ability to score meals? [ LOW / MED / HIGH ]
Following that, we asked them to assign a monetary cost to each feature, using again the options: cheap, affordable, expensive but willing to pay, and unaffordable. For example:
1-hour Coaching with a dietitian (example prices):
- Cheap e.g. $49
- Affordable e.g. $59
- Expensive but would buy e.g. $99
- Unaffordable $119+
It was interesting to note that intra-feature price deviation varied across features.
Certain features were more price insensitive, especially those including human support.
For instance, someone might have mentioned that coaching was of low value to them, but the deviation of price amongst cheap, affordable, etc., was not as high as other features. I would attribute this to a clear understanding of the cost structure by the customers. Everyone understands that dietitians are qualified professionals and acquiring their services would be costly.
We repeated this process for every feature/ hypotheses we had stated above (approximately five key areas). Further statistical analysis and insights generation followed.
Bundle Features & Define pricing
Having a sense of the perception and the value of the features we prioritized different bundles combining various features, presented them to respondents for pricing evaluation (qualitative interview to assess perception of the offering), and collected data on perceived value.
Putting it all together:
By this point we knew:
- Our own goals and principles
- Market: Margins, LTV, upselling, CAC payback times.
- Our own COGS and constraints, lower threshold for pricing.
- The test kit perception and how to avoid being considered a “CGM”, a “blood test” and be labeled the ZOE program. Same for the app.
- We knew thresholds and ceilings for pricing of the test and the app.
- We knew the mix of features were perceived as higher value and how to deliver them in a way that was cost efficient.
- We knew how our competitors were doing and had some validation that we can sell at the described price points.
And so, after statistical analysis and internal conversations on all of the above we concluded with:
Test kit: $294
$59 (mo) / $139 (4mo) / $228 (12mo)
Launching and continuous optimization:
Ensure customers understand the value of the offering early on in the journey and promote them repeatedly across the buying journey to increase conversion. A/B test journey from Landing page to checkout, Track NPS
Landing Page Journey: We featured the highest-rated elements on the landing page and highlighted them in the “what your membership includes” section. We conducted A/B testing on both the quiz/pre-checkout page and various copy variants to ensure people understood what they were buying.
Results:
ZOE experienced explosive growth, increasing revenue by approximately 30x from the time we introduced the new pricing and launched in the UK, which was a critical component. Despite the high uptake and successful launch from a growth perspective, our pricing did cause problems. The issues arose from two parts: firstly, the testing process was more valuable than the rest of the program, and secondly, the program lessons end around 4 months, so there’s a reduced value to either resubscribe after month 4 or use the app for another 8 months if you purchased the annual subscription.
Additional Points:
- Later on we introduced Retesting; pricing was determined purely through quantitative methods and data science.
- UK Launch: We relied on market traction and benchmarked against our own and competitors’ previous launches.
Competitor Benchmarking
Example Tests/Products
| Product | US Customer Facing Cost ($) | UK Customer Facing Cost ($) | UK Customer Facing Cost (£) | % Comparison | US Revenue ($) | UK Revenue (£) | % Comparison |
| 23andMe Health + Ancestry | 199.00 | 202.41 | 149.00 | 2% | 199.00 | 168.68 | -15% |
| Peloton Bike | 1,450.00 | 1,807.20 | 1,350.00 | 25% | 1,450.00 | 1,506.00 | 4% |
| Ageing company X | 348.00 | 394.43 | 289.00 | 13% | 348.00 | 328.69 | -6% |
| DNA Test company Y | 151.20 | 161.92 | 119.20 | 7% | 151.20 | 134.93 | -11% |
| Intolerance test company Z | 149.00 | 202.41 | 149.00 | 36% | 149.00 | 168.68 | 13% |
| Gut health company A | 169.00 | 168.72 | 124.20 | 0% | 169.00 | 140.60 | -17% |
Example Subscriptions
| Product | US Customer Facing Cost ($) | UK Customer Facing Cost ($) | UK Customer Facing Cost (£) | % Comparison | US Revenue ($) | UK Revenue (£) | % Comparison |
| Peloton Monthly Subscription | 39.00 | 52.98 | 39.00 | 36% | 39.00 | 44.15 | 13% |
| Whoop Monthly Subscription | 30.00 | 40.75 | 30.00 | 36% | 30.00 | 33.96 | 13% |
| MyFitnessPal Monthly Subscription | 9.99 | 10.90 | 7.99 | 9% | 9.99 | 9.08 | -9% |
| Noom Quarterly Subscription | 140.00 | 135.01 | 99.00 | -4% | 140.00 | 112.51 | -20% |
| Weight Watchers Monthly Subscription | 29.95 | 26.73 | 19.95 | -11% | 29.95 | 22.28 | -26% |
Lessons Learned
- Pricing strategy is equally art & science: Different pricing models can work as sure as they’re aligned with user value perception which includes industry analysis.
- Learning from others: Speaking to the winners of industries about their lessons is invaluable. Learning from winners saves us from unnecessary mistakes.
- Positioning is Key: “Expensive” is never a comment on price. It’s a descriptor of the “Perceived Value delivered / Promise made” ratio of a product. Those interested in health benefits perceived ZOE as a health program rather than a diet who value the product more and were both willing to pay and happy. Same product, different group, different reaction.
- Simple is always better: Start simple and focus on communicating value. Don’t try to over-optimize early on and especially pre-PMF.
- Pricing Creates Product Expectations: Successfully selling a product is not necessarily end all be all. Customers need to be happy to keep on paying otherwise you might yourself in “goodwill debt” .
- Pricing Affordability Changes with Scale: Transitioning from early adopters to the mass market requires offering increased value at lower prices.
- Value Captured ≠ Value Delivered: The “wow” effect of ZOE comes from the test, the CGM and the test results however profit margins are easier to be achieved from subscriptions, leading to misaligned incentives.
- Product Value catches up to pricing: Higher conversion rates but lower retention rates can be an outcome of misaligned pricing. Pricing can be a complaint facto and should be tracked via qualitative comments on Net Promoter Score (NPS).
- Customer-Centric Approach is Essential: Pricing research should be driven by customer problems. If done again, we would ensure proper research by thoroughly understanding and addressing customer issues, which we initially neglected.
Things to note:
- We did not explore complex feature-based bundles or usage-based pricing.
- Additionally, we did no work on re-subscription and account revival for churned customers; our focus was solely on acquisition. We also refrained from making offers, discounts, or “tests” to boost sales.
- The approach we followed is largely applicable to consumer businesses. For B2B, I would argue that early-stage “pricing by selling” is more effective, along with understanding organizational constraints such as pre-existing budgets, buyer versus user personas, and legal constraints.
Disclaimer: I am a former employee and current shareholder of ZOE. None of the information presented here reflects the company’s current trajectory, nor does it include any confidential information. The goal of this article is solely to educate others based on my personal experience.
